Difference between revisions of "Oscilloscope"
(→Trigger) |
|||
| Line 5: | Line 5: | ||
While working on your labs and homework remember the equation | While working on your labs and homework remember the equation | ||
| − | + | [[File:Freq,period.png]] | |
where f is frequency and T is period (time in seconds). So a 1kHz sinewave would have a period of | where f is frequency and T is period (time in seconds). So a 1kHz sinewave would have a period of | ||
| − | + | [[File:Freq,period-ex.png]] | |
==Buttons== | ==Buttons== | ||
Revision as of 15:13, 13 August 2014
An oscilliscope (o-scope) is used to measure waveforms using scope probes. An Oscilliscope primarily display voltage over time. Voltage is displayed on the vertical scale and time on the horizontal scale. The scopes in the RBE lab are capable of measuring up to two different channels at a time.
While working on your labs and homework remember the equation
where f is frequency and T is period (time in seconds). So a 1kHz sinewave would have a period of
Contents
Buttons
The included image shows some of the main buttons on the scope that you will constantly use.
The blue select buttons are used to choose options in the popup menu, the knob chooses sub-options by turning it and pressing to select and the small white button closes any menu.
The CH1 and CH2 button next to the selects turns on and off the probes being displayed.
The scales and offsets allow for positioning the waveform on the screen to your liking. Pressing in the voltage offset knob or the time offset knob sets the offsets to zero. Pressing in the voltage scale button allows for fine/coarse mode for the scale while pressing the time scale button allows for you to zoom in on a section of the waveform.
The trigger knob sets the trigger level while pressing it in sets it to 50% of the waveform and is the same as the 50% button.
RUN/STOP at the top right of the scope allows for you to pause the waveform so it doesn't move on you if you are measuring two waveforms operating at different frequencies or are not triggering properly.
Measuring a Waveform
Before You Begin
Before you try to measure a waveform you need to do a few things. The first it to set the attenuation to 1x or 10x on both the scope and the probe to the level you desire. The 1x setting means your signal will be a 1:1 ratio, what you measure will be represented normally on your screen and a 10x setting is 10:1 where everything is amplified by 10. The 10x setting is for measuring small signals that are hard to see, in this class you should use the 1x setting.
To set the probe, there is a simple switch that can be set to either setting and on the scope you need to press the button for the channel you are using. You then select the attenuation setting and use the menu knob to select the matching setting and you are good to go.
Trigger
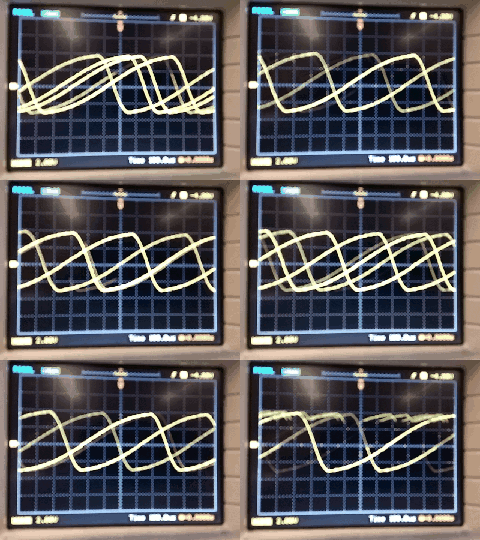
When you first connect the o-scope to a waveform it might look something like the accompanying image. The expected output is a 1kHz waveform which this looks nothing like. To fix this, adjust the trigger level by turning the trigger knob on the right hand side of the o-scope until the orange line is on your waveform at the position you want. You can also press in the knob to set the line to the middle of the screen.
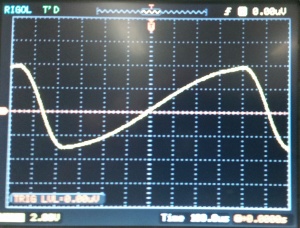
Once triggered, you will see an image similar to the example, which no longer moves but is not scaled well to see much of anything. To fix this, we can scale the waveform on the time scale as well as the voltage scale until we get something we desire.
Scales and Positioning
To first adjust time, you need to turn the large knob labeled Scale under the Horizontal category. Adjust it as appropriate until your waveform is the way you desire and shows you data that is useful for your application. If it is for a report make sure when shrunk down on paper you can still see it well.
Next adjust the voltage knob to the left of the timescale knob to change it if needed. If you press the knob in and release, you can switch to fine adjustments and change in smaller increments.
The smaller knob above each of the scaling knobs can be used to shift the level in time or along the y-axis. This is more helpful when you have multiple signals so you can view them side-by-side. Pressing in these knobs will zero them out (0V at the center of the vertical and no time-shift).
Automatic Configuration
The auto button can be used to automatically scale and trigger the waveform, however it almost always does a poor job. You should typically do everything manually as it gives you much better results, however using Auto will sometimes give okay results or can be used as a starting point.
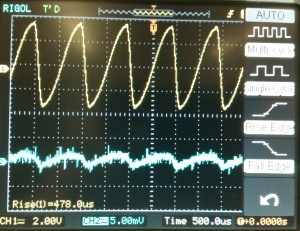
When you press auto if both channels are connected you will get something like the example image. As can be seen it does a poor job by scaling voltage poorly as it included the second channel which is not even connected to anything.
Taking Measurements
Often times you will want to measure something on the waveform that is tedious to do by counting divisions on the scope. There are two different modes that you will find useful, measurement mode and cursor mode.
Measurements
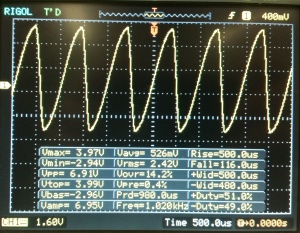
The measurements button allows for you to turn on the Display All option to get all the data about the waveform you could want as shown in the image. This is one of the more useful features on the scope that you will use in most of your classes for inclusion in your reports as it contains almost everything you're supposed to be looking for.
Cursor
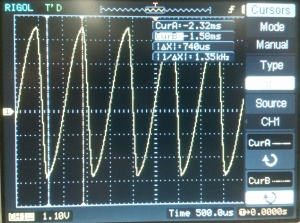
The cursor can be used to measure both a voltage difference or a time difference between two points by first pressing the cursor button. Next, change the mode to manual and set Type to X for time and Y for voltage. Select either CurA or CurB to move the cursors separately or both of them at the same time to move them together with the menu knob. When you have the cursors active a popup menu will tell you the difference between the cursors as well as their individual positions.
Measuring Two Waveforms
Measuring two waveforms is exactly the same as one, except that you change between the two signals by pressing the CH1 and CH2 buttons next to the screen. You can then scale and reposition the signals as you normally would do until they are how you want them.
Saving Data
Data can be saved directly from the o-scope in many formats, the ones most usable to you being a bitmap image (.bmp) or as an Excel file (.csv). To save a waveform first inset a USB stick into the USB port. Once a pop-up says it has been installed, go to the Storage menu and select your file type by changing Storage. Once you select the type of file you want you can then press External and then New File and pressing Save after giving it a name.
Bitmap
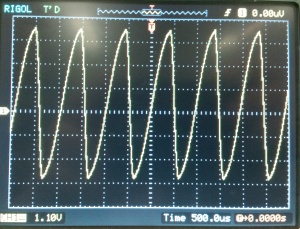
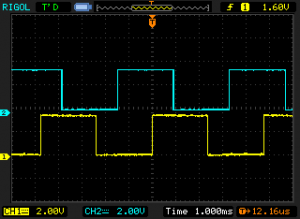
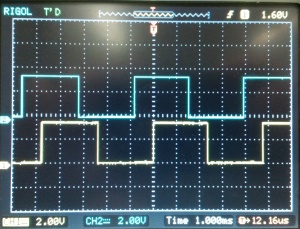
Saving as a bitmap looks like the accompanying image, however note that it is very low resolution at 320 x 234 px. This will likely not be an issue with your reports, but that depends on your formatting and you may need a larger image.
CSV
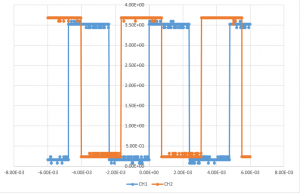
Creating a .csv file give you data points that you can construct into your own graph, or import into a tool such as MATLAB to do analysis on. The graph however can look unseemly as does the example image without doing a extra work to make it nicer.
Camera
If you need a higher resolution image, the simplest solution is to just use the camera on your (or your partners) phone. You can then take the image into an image editing program like MS Paint and simply crop the image to only include the screen. The example image was taken with a 16MP camera and 3,353 x 2,561 pixels are of the cropped screen which was not careful with trying to get as much of the screen as possible into the frame.


